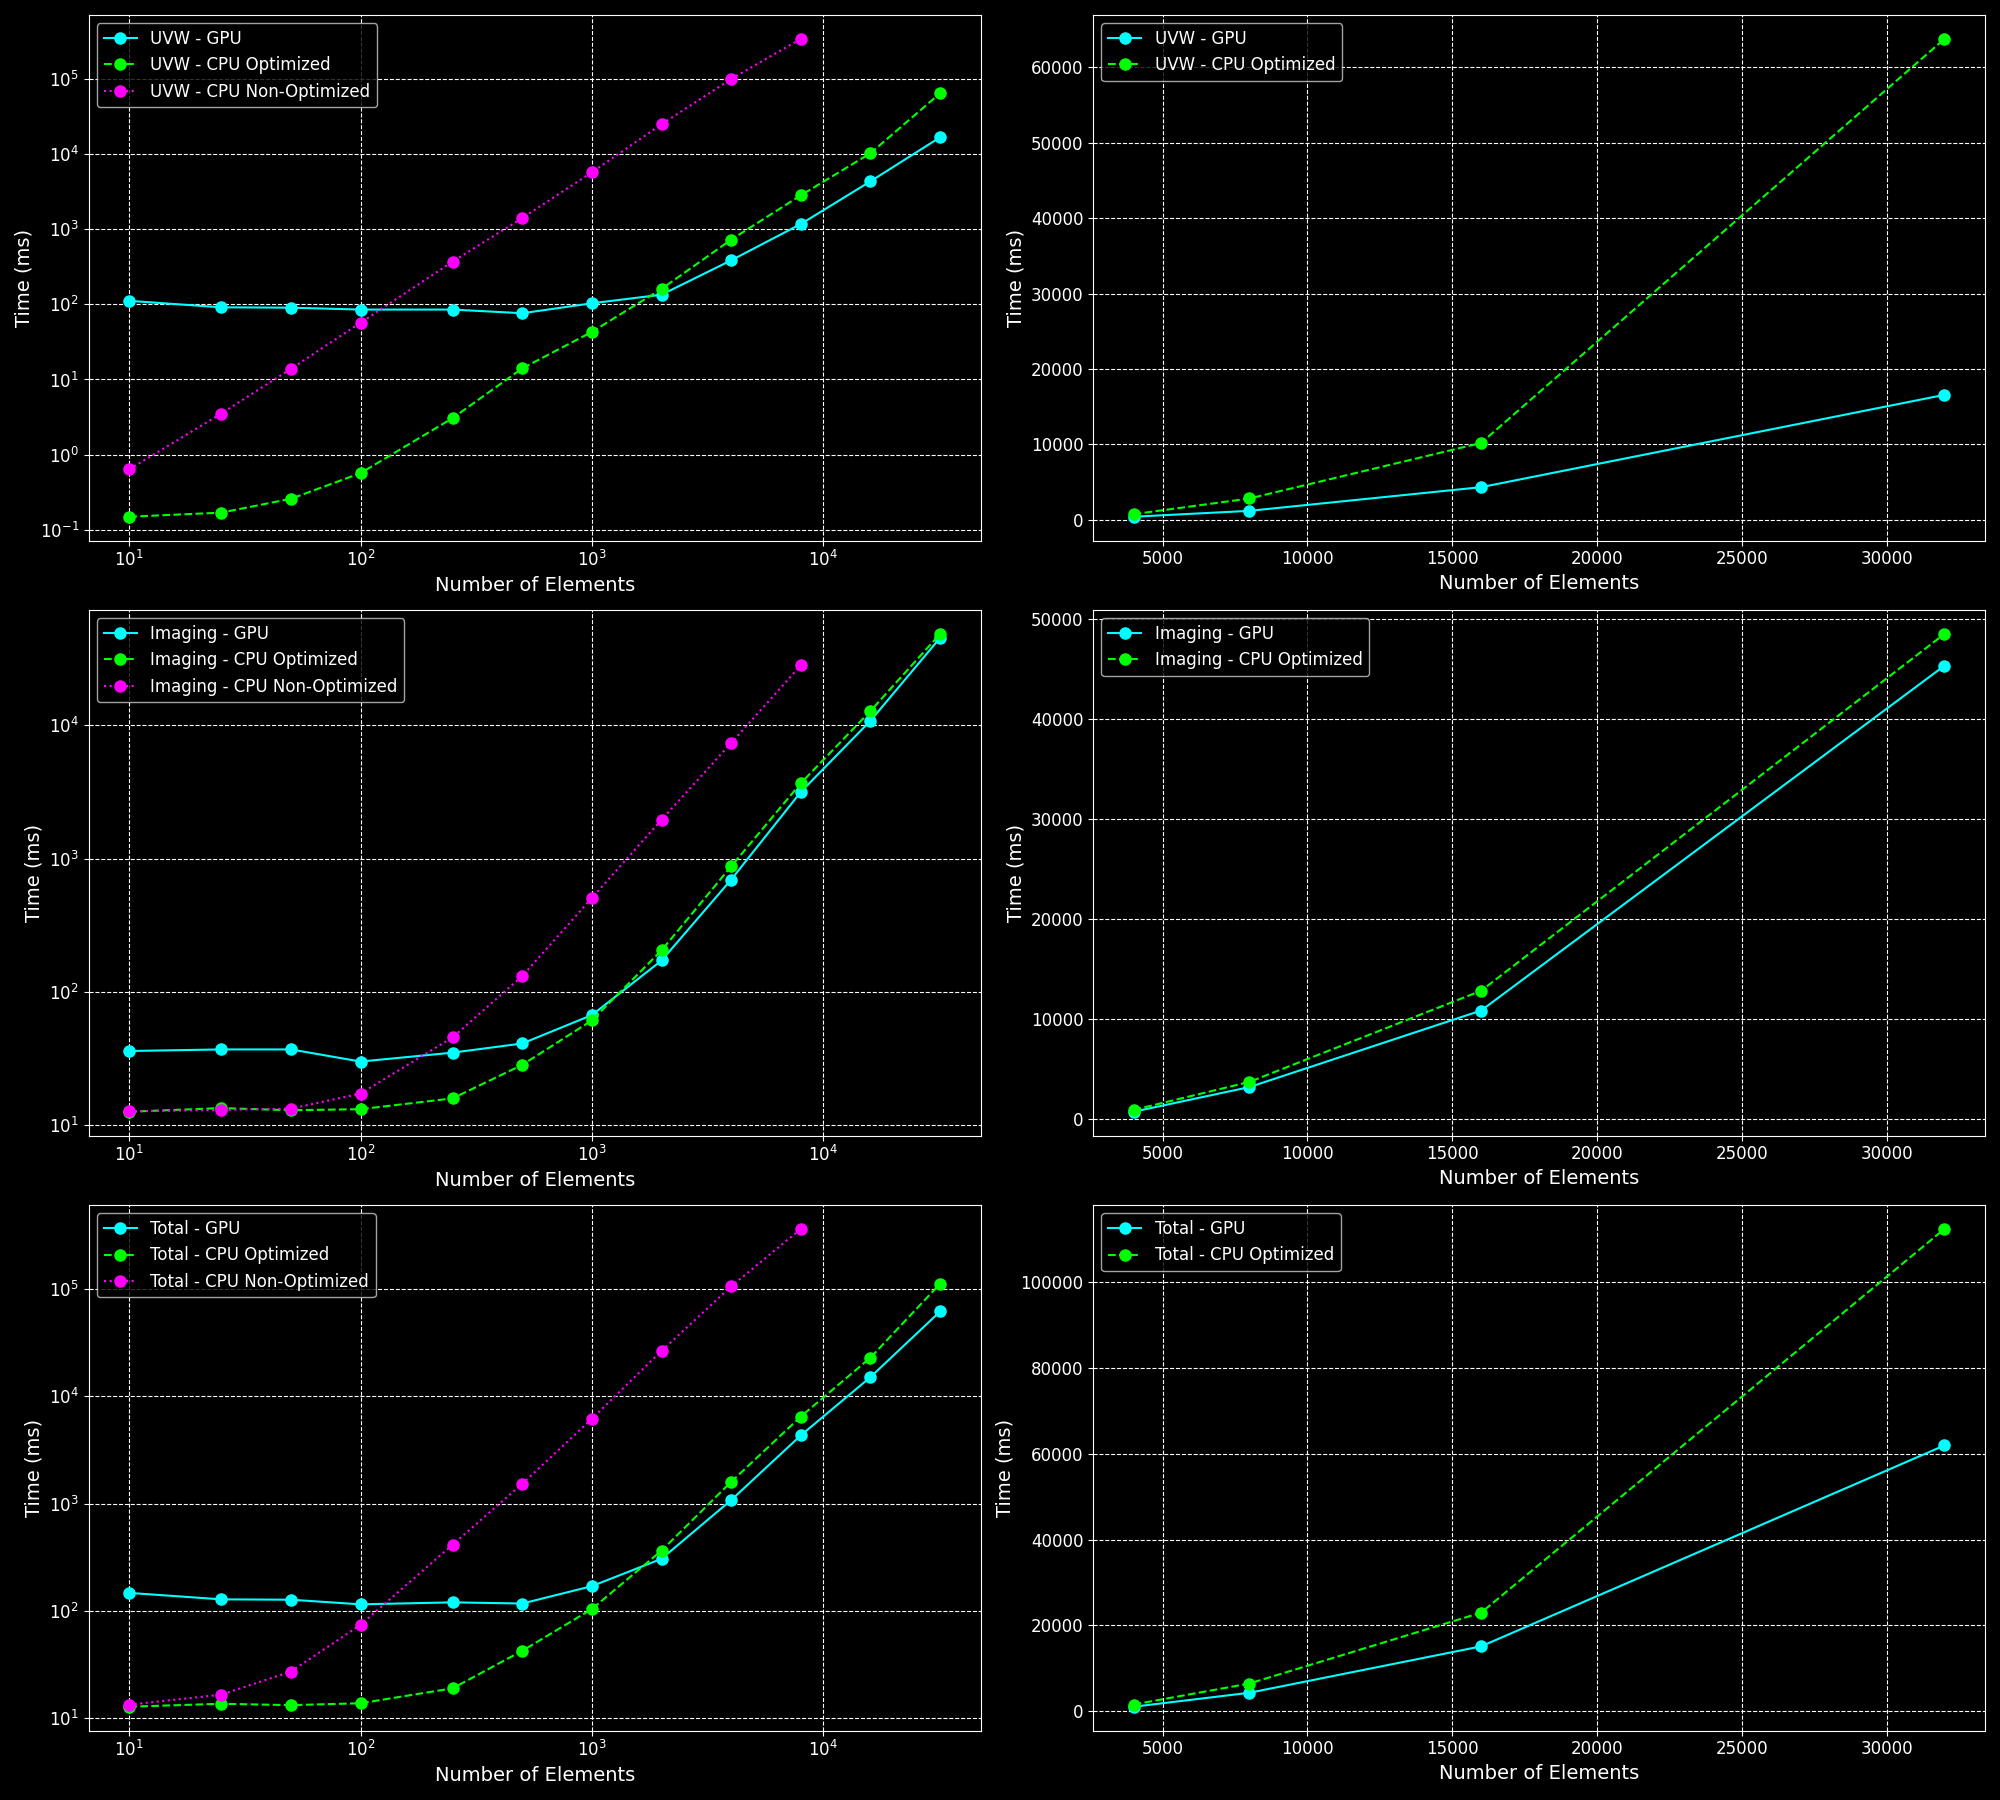
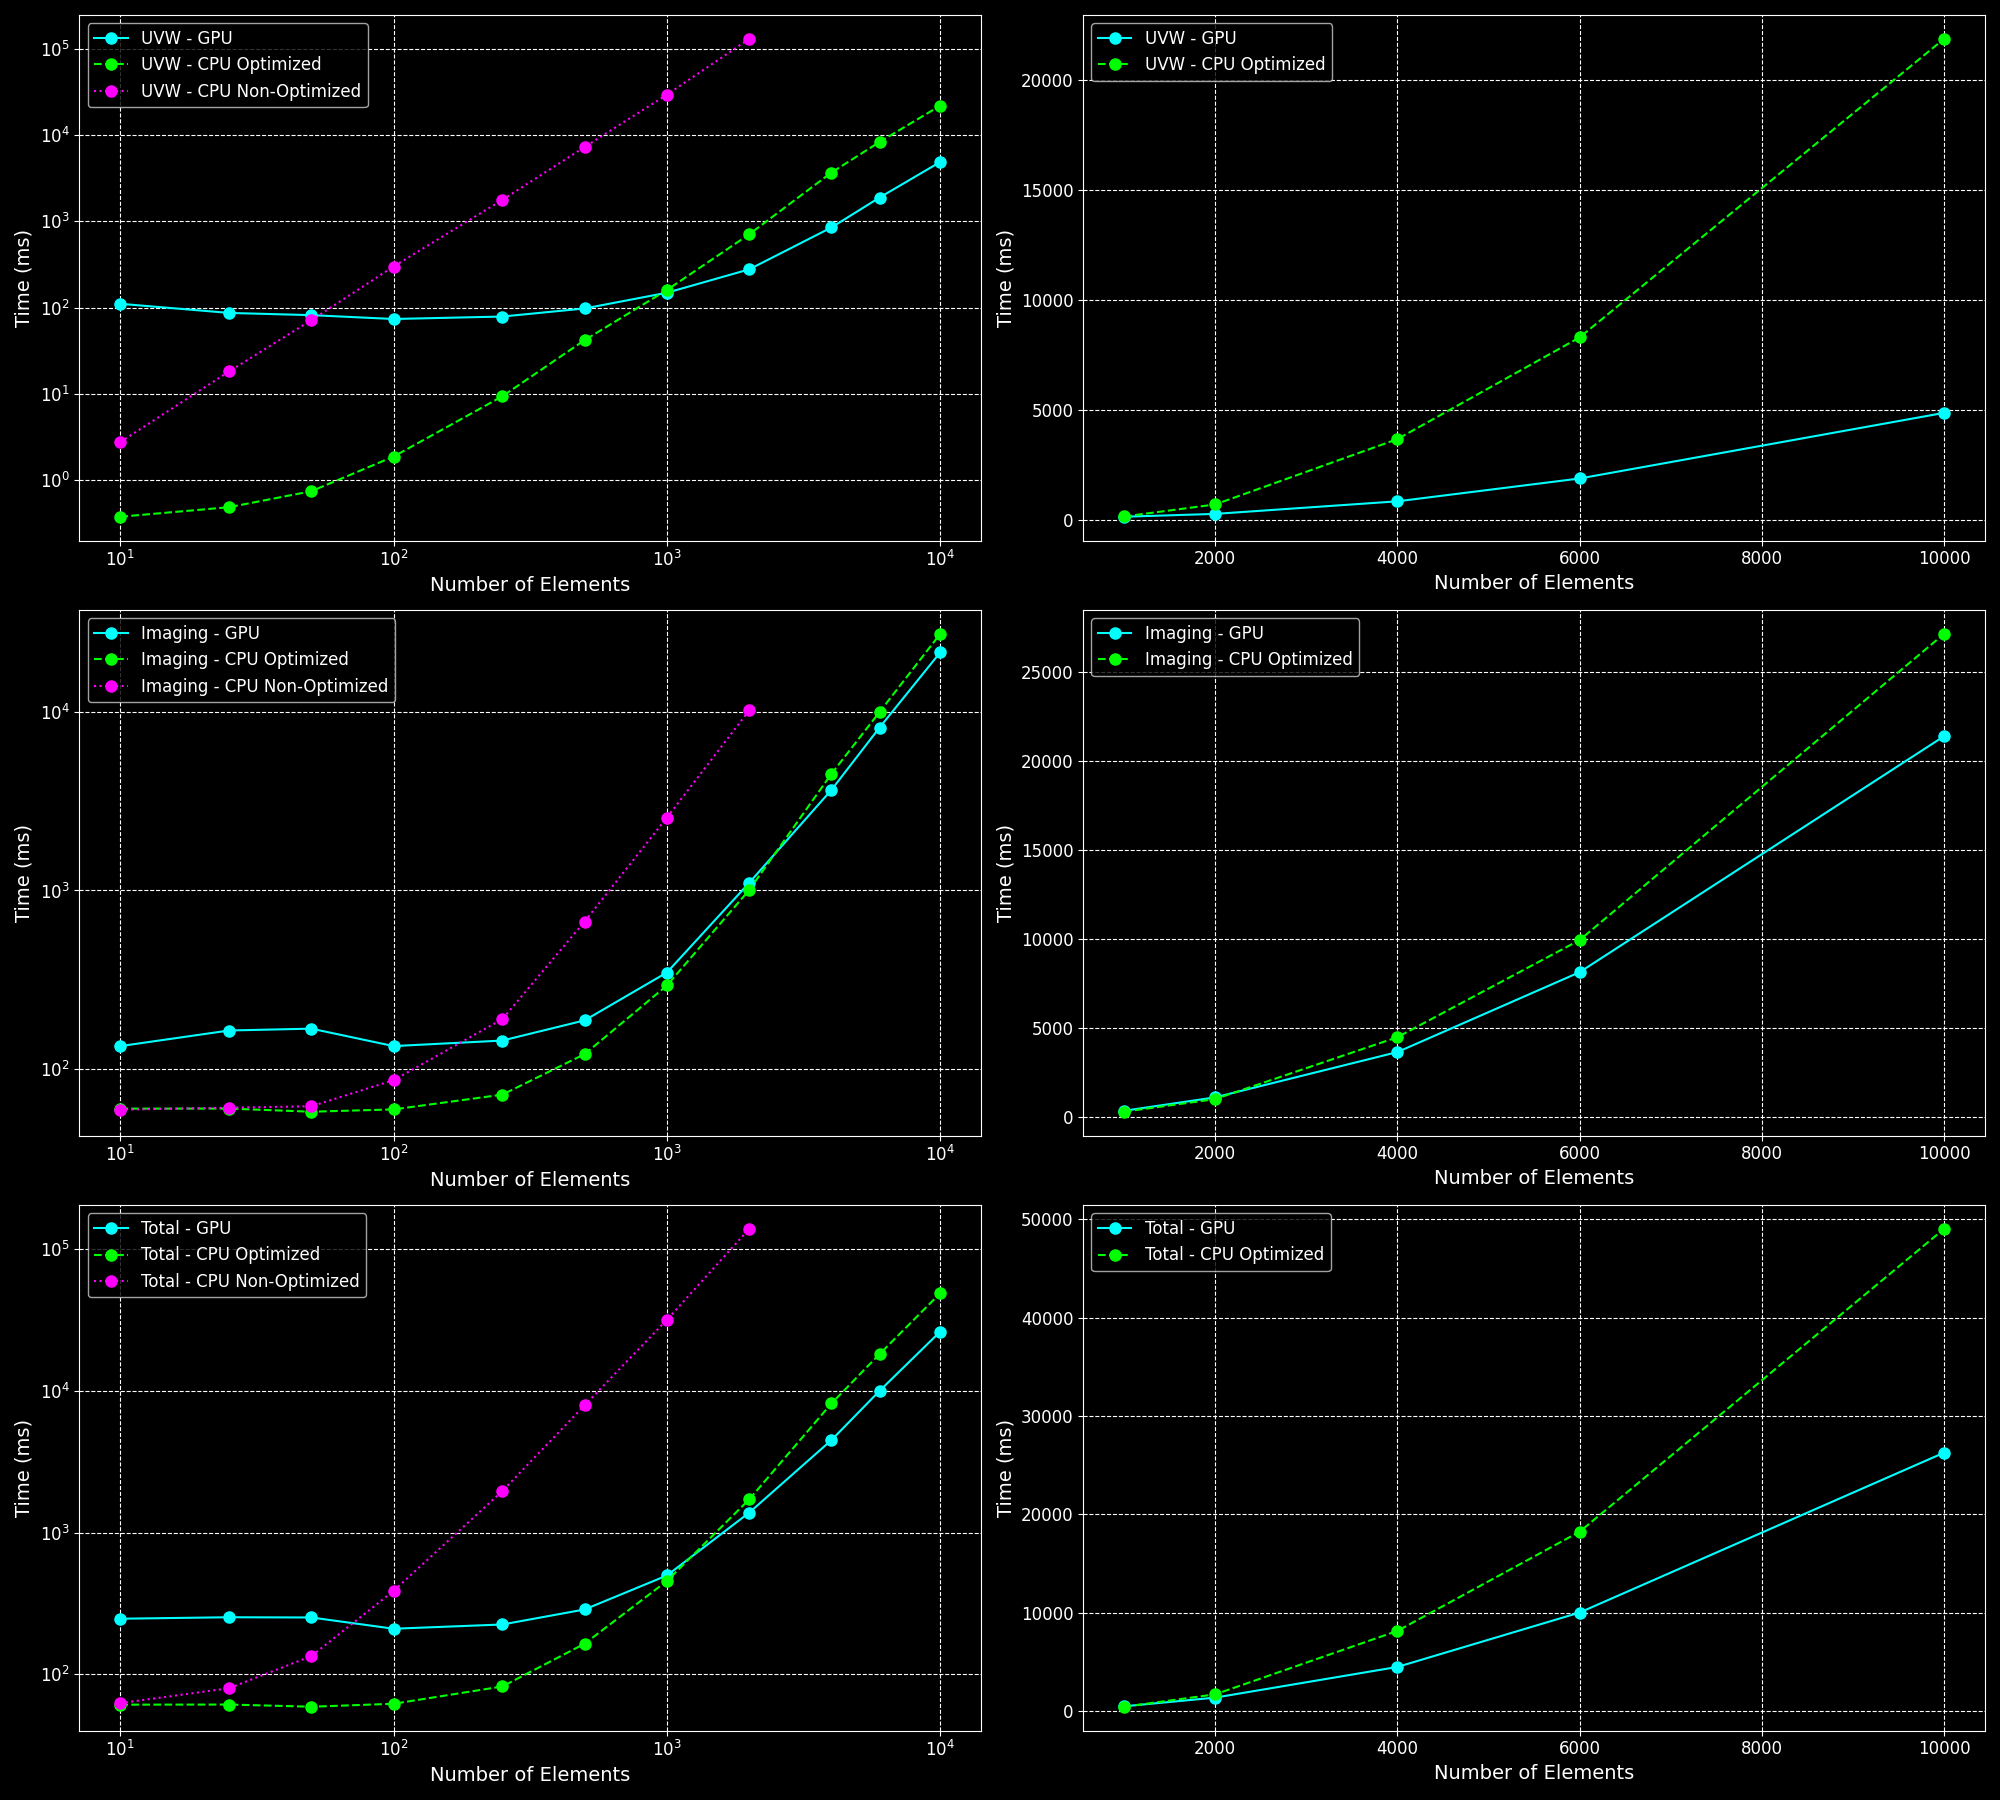
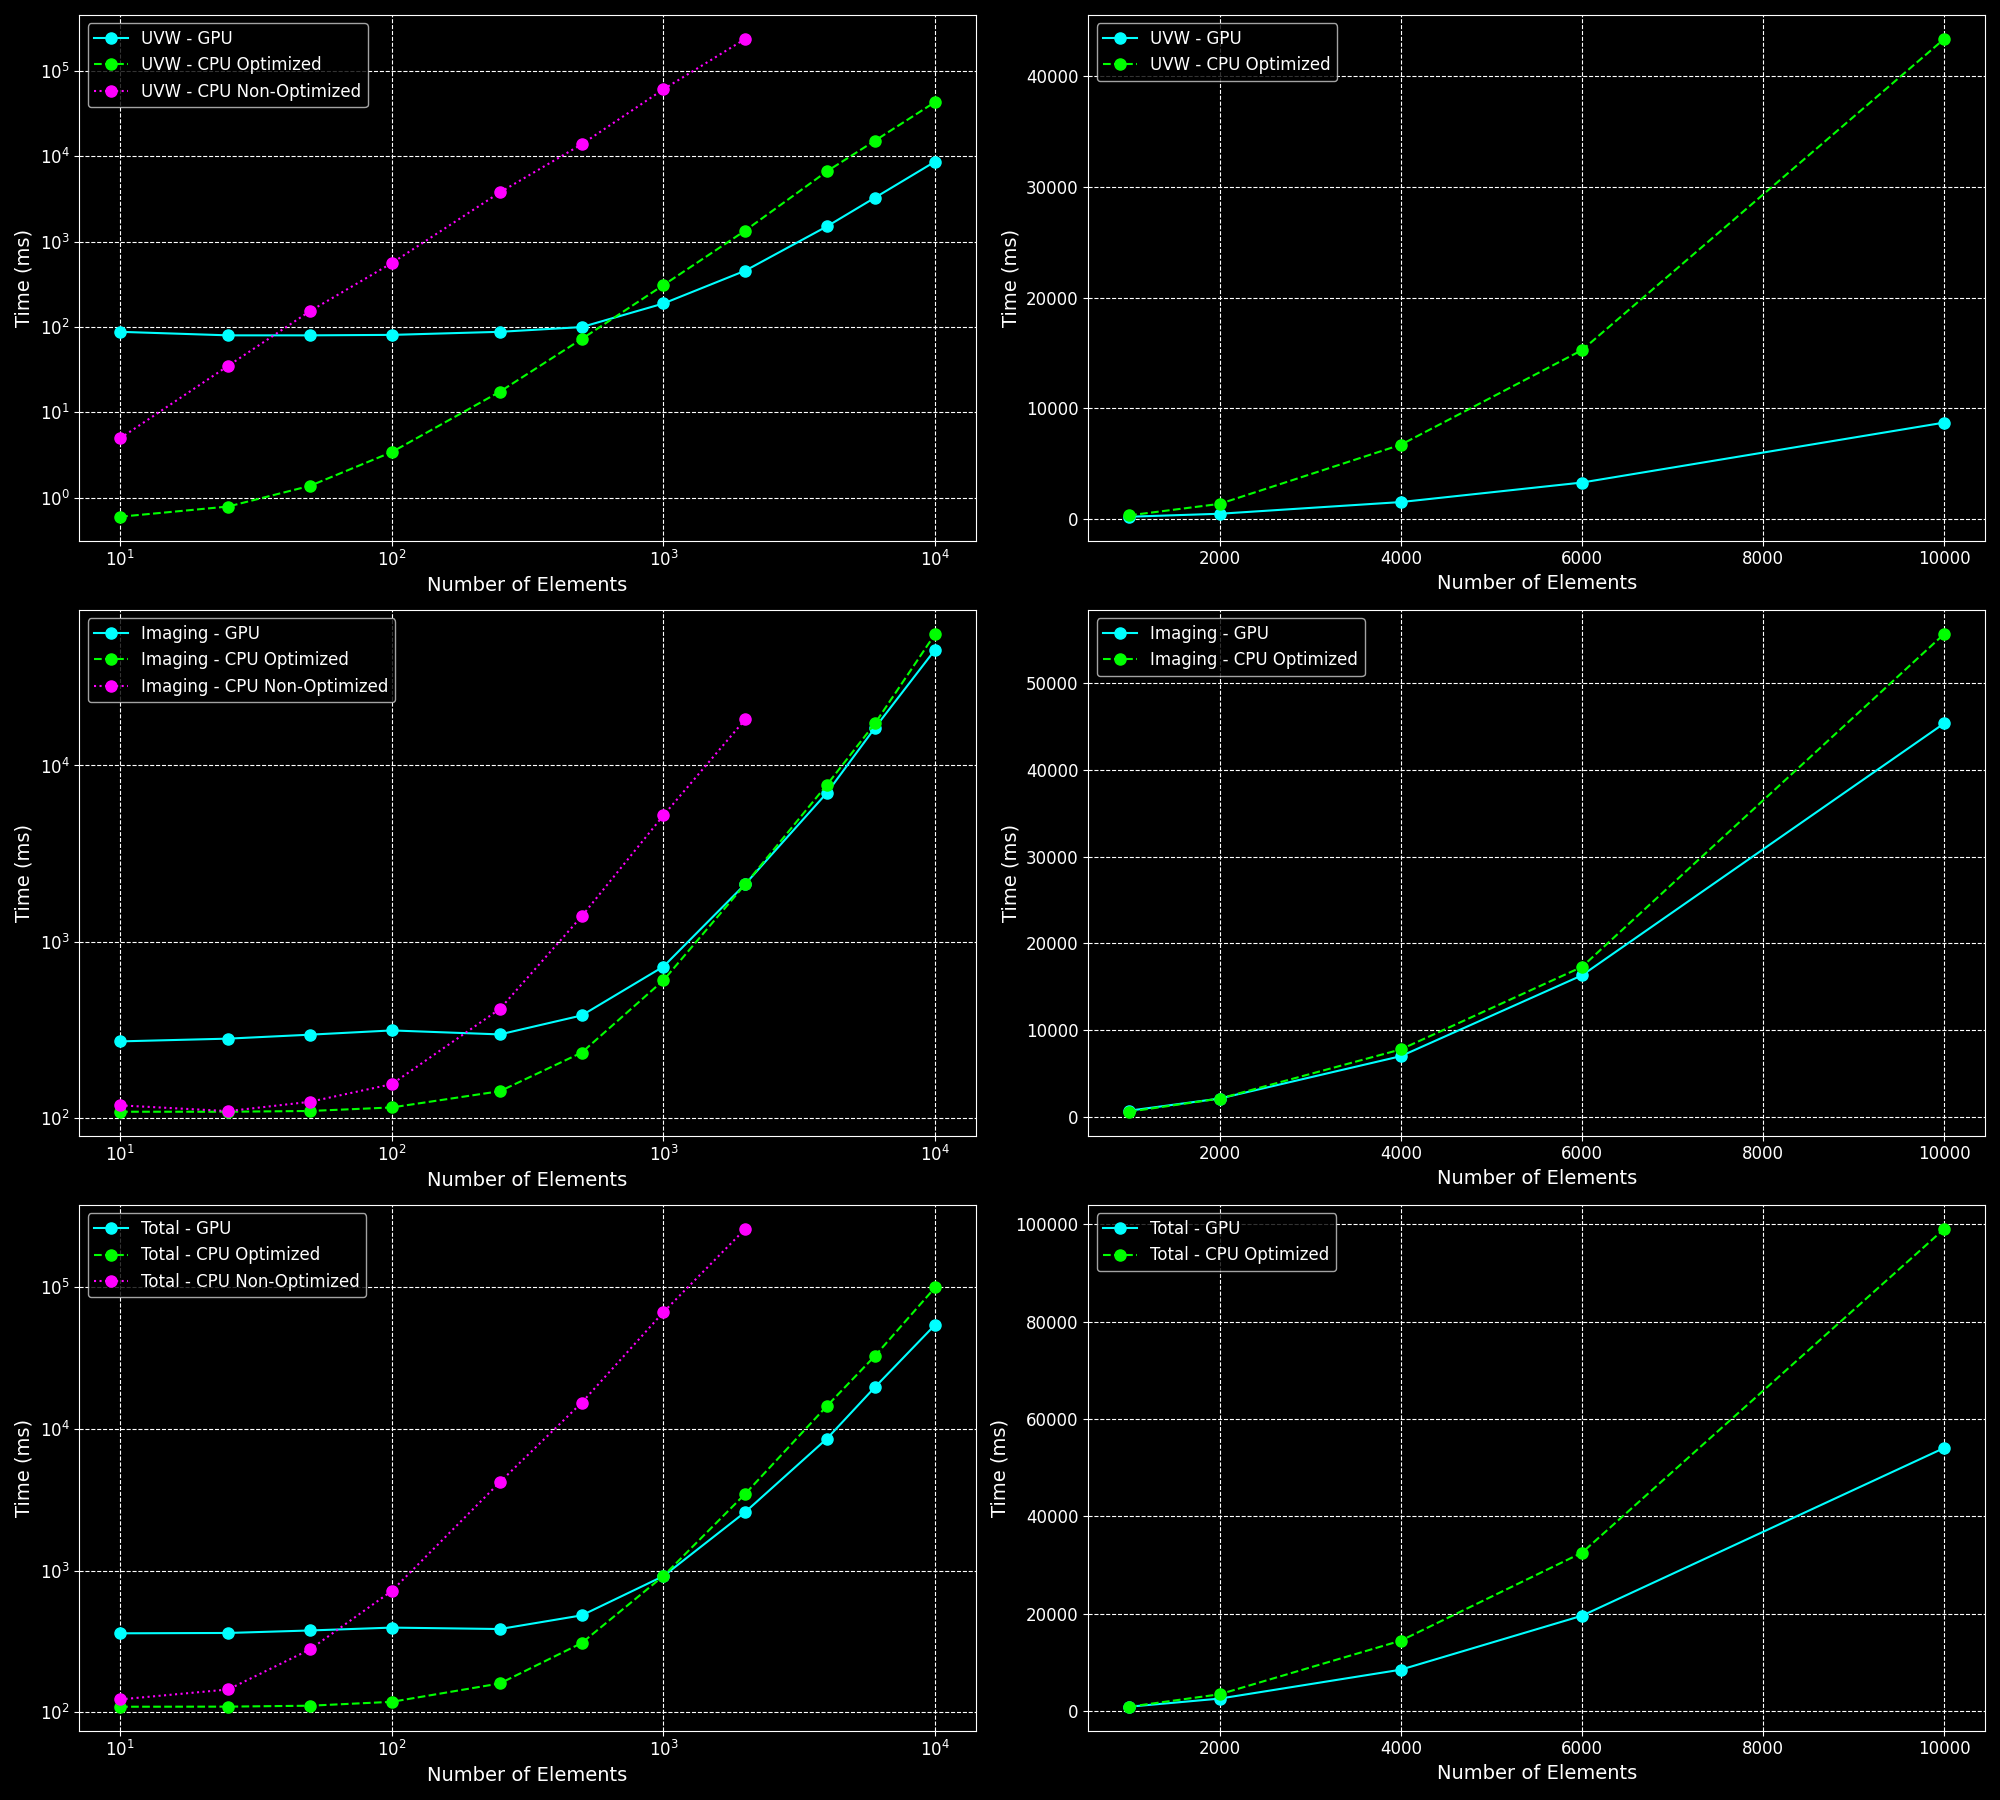
This part presents the performance analysis of UVW and Imaging computations using GPU and CPU implementations (both optimized and non-optimized). The plots below compare the computation times across different numbers of elements using a log scale for UVW, Imaging, and Total computation times. Additionally, the right-hand plots provide a linear scale view for the number of elements where GPU starts to become better than optimized CPU.
Performance Comparison
Different Numbers of Directions
1 Direction
The performance comparison for 1 direction shows that the GPU implementation starts to outperform the optimized CPU implementation as the number of elements increases. However, for a smaller number of elements, the overhead of data transfer makes the GPU slower.

5 Directions
For 5 directions, the GPU shows more consistent improvements over the CPU implementations. The parallelization benefits of the GPU become more pronounced, making it significantly faster for larger numbers of elements.

10 Directions
Same as for 5 directions but even more pronounced.

Observations
- Large Number of Elements: The GPU outperforms both the optimized and non-optimized CPU implementations for a large number of elements. However, it is slower for a small number of elements due to the overhead of transferring data between the host and the device.
- Optimized vs. Non-Optimized: Both the optimized CPU and GPU implementations are much faster than the non-optimized versions.
- UVW Calculations: The GPU is significantly faster for UVW calculations with a large number of elements.
- Imaging Calculations: The speedup for imaging calculations is less pronounced, likely due to the fixed grid size (image size of 512) when dealing with a small number of directions.
- Parallelization Benefits: For larger batches of directions (around 10), GPU improvements become more pronounced due to parallelization of multiple directions.
- Large Number of Directions: For a very large number of directions (around 100), transferring data between the host and the device becomes a bottleneck, and the GPU performance is worse compared to the CPU.
Visual Analysis
Below is a video showing how different numbers of arrays (elements) affect the resulting image (images are shown for different directions). One can use the GPU-accelerated software to quickly test their PSFs for different array configurations, observational directions, and potential artifact identification.
GPU Activity Duration
The NVIDIA profiler was used on the GPU-accelerated software with the following command:
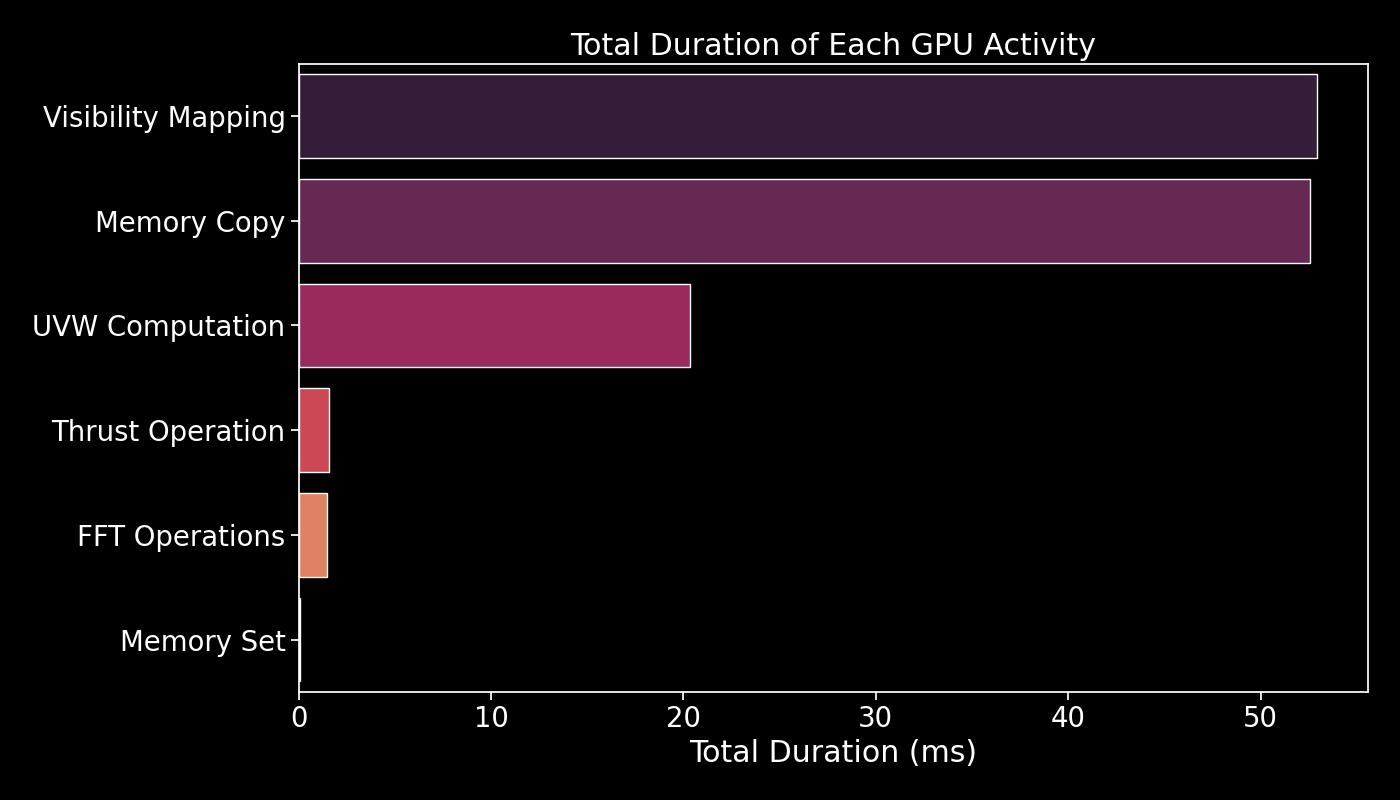
This run was performed with 2000 elements and 5 directions. The resulting image below shows the total duration of each GPU activity:

- Visibility Mapping: Mapping visibility data onto a grid.
- Memory Copy: Transferring data between host and device memory.
- UVW Computation: Calculating UVW coordinates from XYZ coordinates.
- Thrust Operation: Performing operations using Thrust library.
- FFT Operations: Executing Fast Fourier Transforms.
- Memory Set: Initializing and setting memory values.
CSV Data
The performance data is provided in CSV files, gpu_timings.csv and cpu_timings.csv. Below is the format of these files (all times are in ms):
GPU Timings
| num_elements | num_directions | uvw_time | imaging_time |
|---|---|---|---|
| 10 | 1 | 111 | 36 |
| 25 | 1 | 91 | 37 |
| ... | ... | ... | ... |
CPU Timings
| num_elements | num_directions | optimization | uvw_time | imaging_time |
|---|---|---|---|---|
| 10 | 1 | optimized | 0.15 | 12.61 |
| 10 | 1 | non-optimized | 0.64 | 12.70 |
| ... | ... | ... | ... | ... |
Generated by